EPAM Proton Flux 2-Hour
Short-term proton flux—used to detect rapid solar particle changes and shock arrival.
EPAM Proton Flux 24-Hour
Daily proton flux trends—useful for tracking CME onset and radiation buildup.
EPAM Proton Flux 7-Day
Full 7-day proton flux history—used to detect solar particle storms and CME precursors.
MAG Field 2-Hour

Real-time magnetic field strength and orientation—critical for geomagnetic storm onset.
MAG Field 24-Hour

Daily magnetic field fluctuations—used to assess solar wind coupling with Earth's field.
MAG Field 7-Day

Extended magnetic field trends—used to track solar wind structures and storm evolution.
SWEPA Solar Wind 2-Hour
Short-term solar wind speed, density, and temperature—used for shock detection.
SWEPA Solar Wind 24-Hour
Daily solar wind parameters—used to monitor CME arrival and solar wind impact.
SWEPA Solar Wind 7-Day
Extended solar wind history—used to assess long-term solar wind behavior.
SIS High-Energy Particles 2-Hour
Short-term high-energy ion flux—used to detect radiation spikes and solar flare effects.
SIS High-Energy Particles 24-Hour
Daily ion flux trends—used to monitor radiation hazards and space weather alerts.
SIS High-Energy Particles 7-Day
Extended ion flux history—used to assess solar energetic particle events.
Aurora Forecast – Northern Hemisphere

Forecast of auroral activity in the northern hemisphere—based on geomagnetic conditions.
Aurora Forecast – Southern Hemisphere
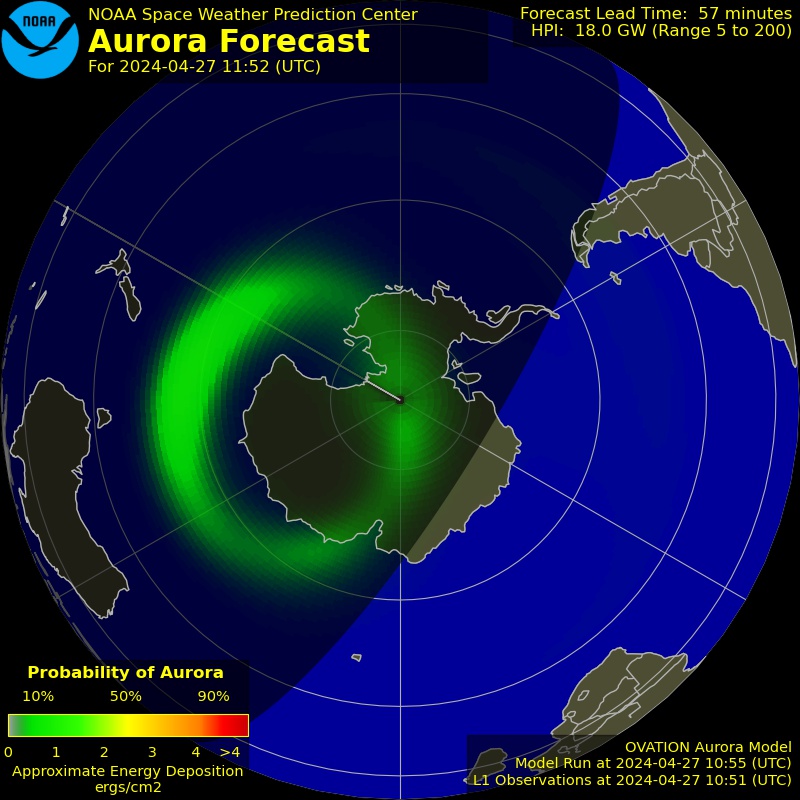
Forecast of auroral activity in the southern hemisphere—useful for Aotearoa and polar regions.
K-Index
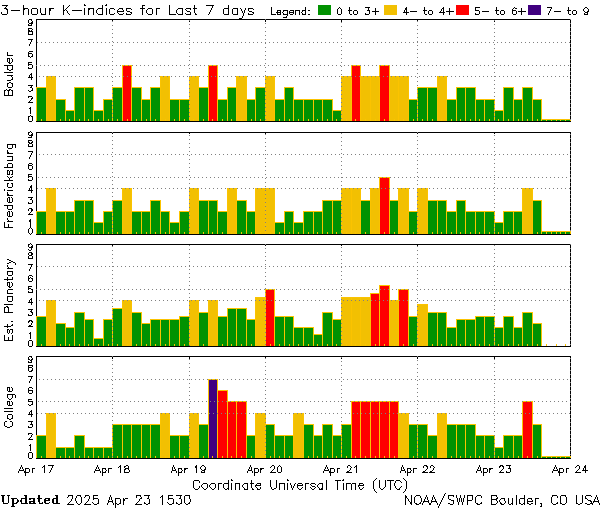
KP Index
Solar X-Ray Flux Chart
This chart shows X-ray flux levels as measured by the GOES satellites.
If radio bands go silent suddenly, check this chart for recent flare activity.
Solar Wind
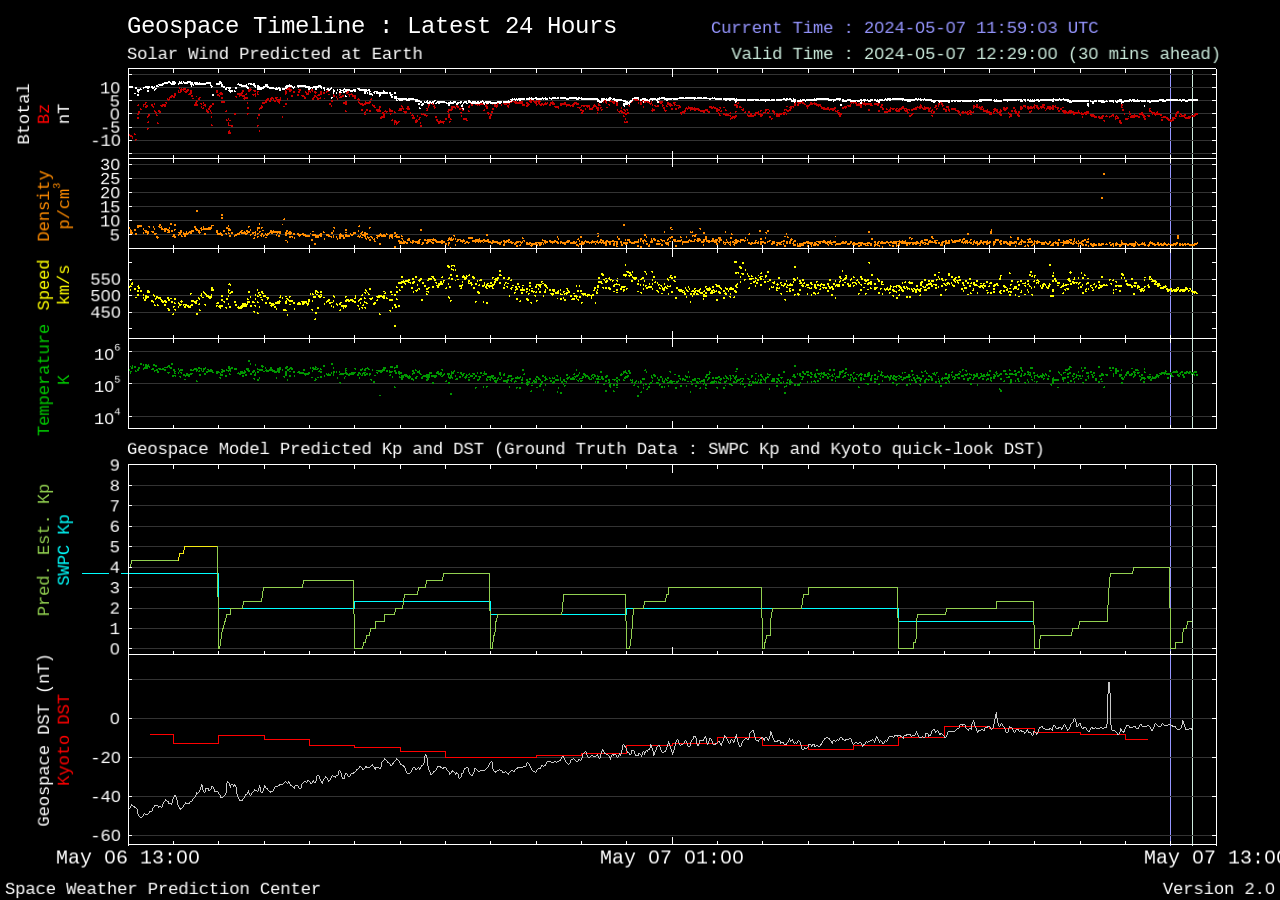
This chart displays a global map of geomagnetic activity over the past 24 hours, as modeled by NOAA’s Geospace system. It uses color-coded intensity zones to show how Earth’s magnetic field is being affected by solar wind and interplanetary magnetic field (IMF) conditions.
Red and orange zones indicate areas of strong geomagnetic disturbance, often linked to solar storms or coronal mass ejections (CMEs).
Green and blue zones reflect quieter magnetic conditions.
The model is based on real-time solar wind data from satellites like DSCOVR and ACE
Red and orange zones indicate areas of strong geomagnetic disturbance, often linked to solar storms or coronal mass ejections (CMEs).
Green and blue zones reflect quieter magnetic conditions.
The model is based on real-time solar wind data from satellites like DSCOVR and ACE
DRAP Global Chart
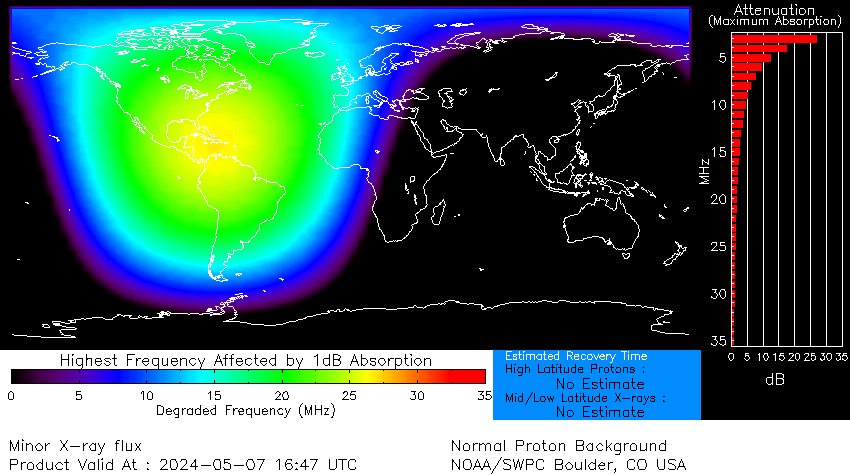
This chart visualizes D-region absorption levels across the globe, derived from GOES satellite ionospheric monitoring.
🧭 What This Chart Encodes
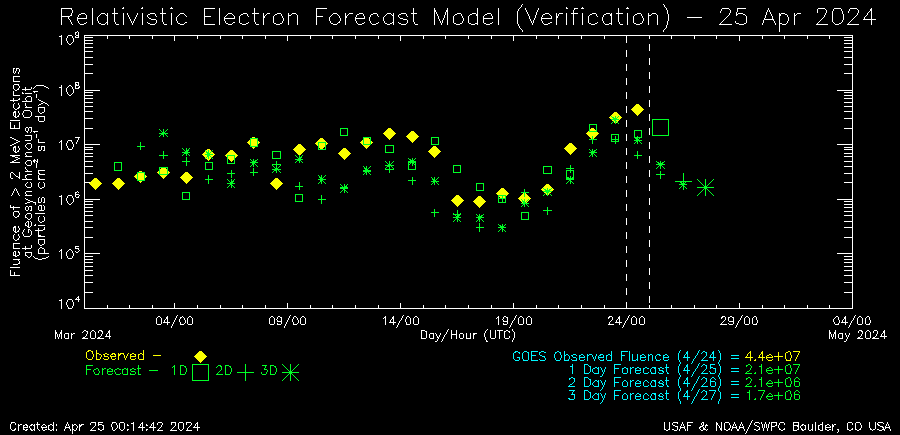
This chart visualizes relativistic electron fluence forecasts and observations, derived from GOES satellite data and modeled by USAF & NOAA. It tracks high-energy electron levels in Earth’s outer radiation belt, which can affect satellite operations, communications, and space weather conditions.
📊 Key Elements to Mention
- Fluence [MeV/cm²-s-sr]: Measures the intensity of relativistic electrons—particles moving near light speed.
- Observed vs Forecasted:
🟩 Green asterisks = actual observed data (10-day average ± 3-day spread)
🟨 Yellow diamonds = forecast based on 10-day model
🟧 Orange squares = forecast based on 3-day model
- Vertical dashed line: Marks the current verification date
- Logarithmic scale: Y-axis spans from 10⁴ to 10⁷, showing exponential changes in particle fluence.